Chapter 1 Introduction to Energy Systems

1.1 Energy definition

1.1.1 Energy definition

Energy is the capacity that a given system has to change the state of other systems, like changing the velocity or the temperature.

All changes that occur in nature are caused by some form of energy exchange. Energy is therefore always a transference between systems and cannot be created or destroyed.

This basically describes the first law of thermodynamics, the energy conservation principle. There are many forms of energy, but they can all be categorized into two groups:

Potential energy describes the forms in which energy is stored in a system, like nuclear, chemical, gravitational, thermal;

Kinetic energy describes the forms in which energy is transferred like work (mechanical or electrical) or heat.

1.1.2 Power definition

Power is the rate at which energy is transferred from or to a system and its unit is Watt which corresponds to 1 J per second Energy is a scalar unit and in the International System of Units (SI) is measured in Joule (J). 1 Joule is the energy exchanged, for example, while applying a force of 1 newton (N) to move a body for 1 meter (m), or passing a current of 1 ampere (A) in a resistance of 1 ohm (O) for 1 second (s) or, heating 1 g of air to increase 1 K.

The first measurements of energy were done while measuring heat using a Calorimeter. It represents the energy required to increase 1ºC to 1g of water at 14.5ºC.

In the case of energy the use of SI unit is not the standard.In fact, the unit that is used depends very much on the context.For example, when talking about electricity, the kilowatt-hour (kWh) is the most used unit; when talking about space heating and cooling,the British Thermal Unit (BTU) is still very common when talking about the energy consumption of a country, the Tonne of Oil Equivalent (toe) is still the prevailing unit.

\[E (kWh) = P(W) \times t (hr)1000\]

Where:

\(E\): Energy (unit of, measured in kWh)

\(P\): Power (unit, measured in Watts)

\(T\): time period (measured in hours)

1.2 Energy System

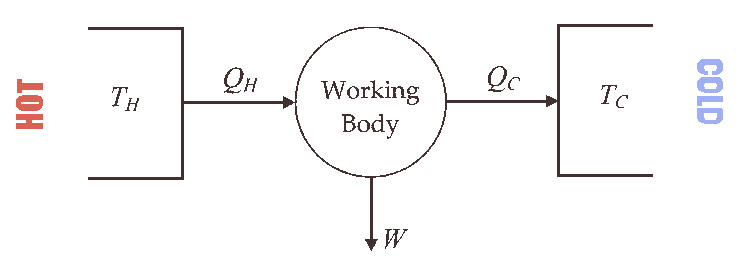
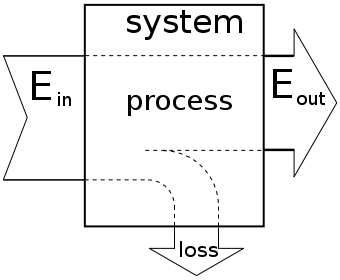
Energy system is a well-defined system in which energy flows enter the system to perform certain activities.

It can be converted into multiple forms (energy output) and according to the second law of thermodynamics, a fraction of it is always lost in the conversion process.It may represent, for example, a car engine, a house, a machine or the country’s energy system.In any energy system, we have some energy conversion process, which is the process of changing one form of energy to another.

The metric that measures the energy conversion efficiency is called the system efficiency.

Is the ratio between the Energy Output over the Energy Input. Remember that this value may be smaller than one (e.g. in thermal engines) or greater than one (e.g. in heat pump systems).

1.2.0.1 First law Efficiency

The first law states that energy cannot be created or destroyed, but can be converted from one form to another.

As an equation:

\[E_{system} = 0 = E_{in} – E_{out}\]


\[W_{cycle} = Q_{out} - Q_{in}\] or

\[\gamma = \frac{Q_{out}}{W} = \frac{Q_{out}}{Q_{out}-Q_{in}} =\frac{1}{1-\frac{Q_{in}}{Q_{out}}}\]

1.2.0.2 Energy Efficiency \(\mu\) (as %):

Energy conversion efficiency \(\mu\) is the ratio between the useful output of an energy conversion machine and the input.


\(\mu = \frac{energy \, output}{energy \, input} \times 100\)


1.2.1 Reference Energy System

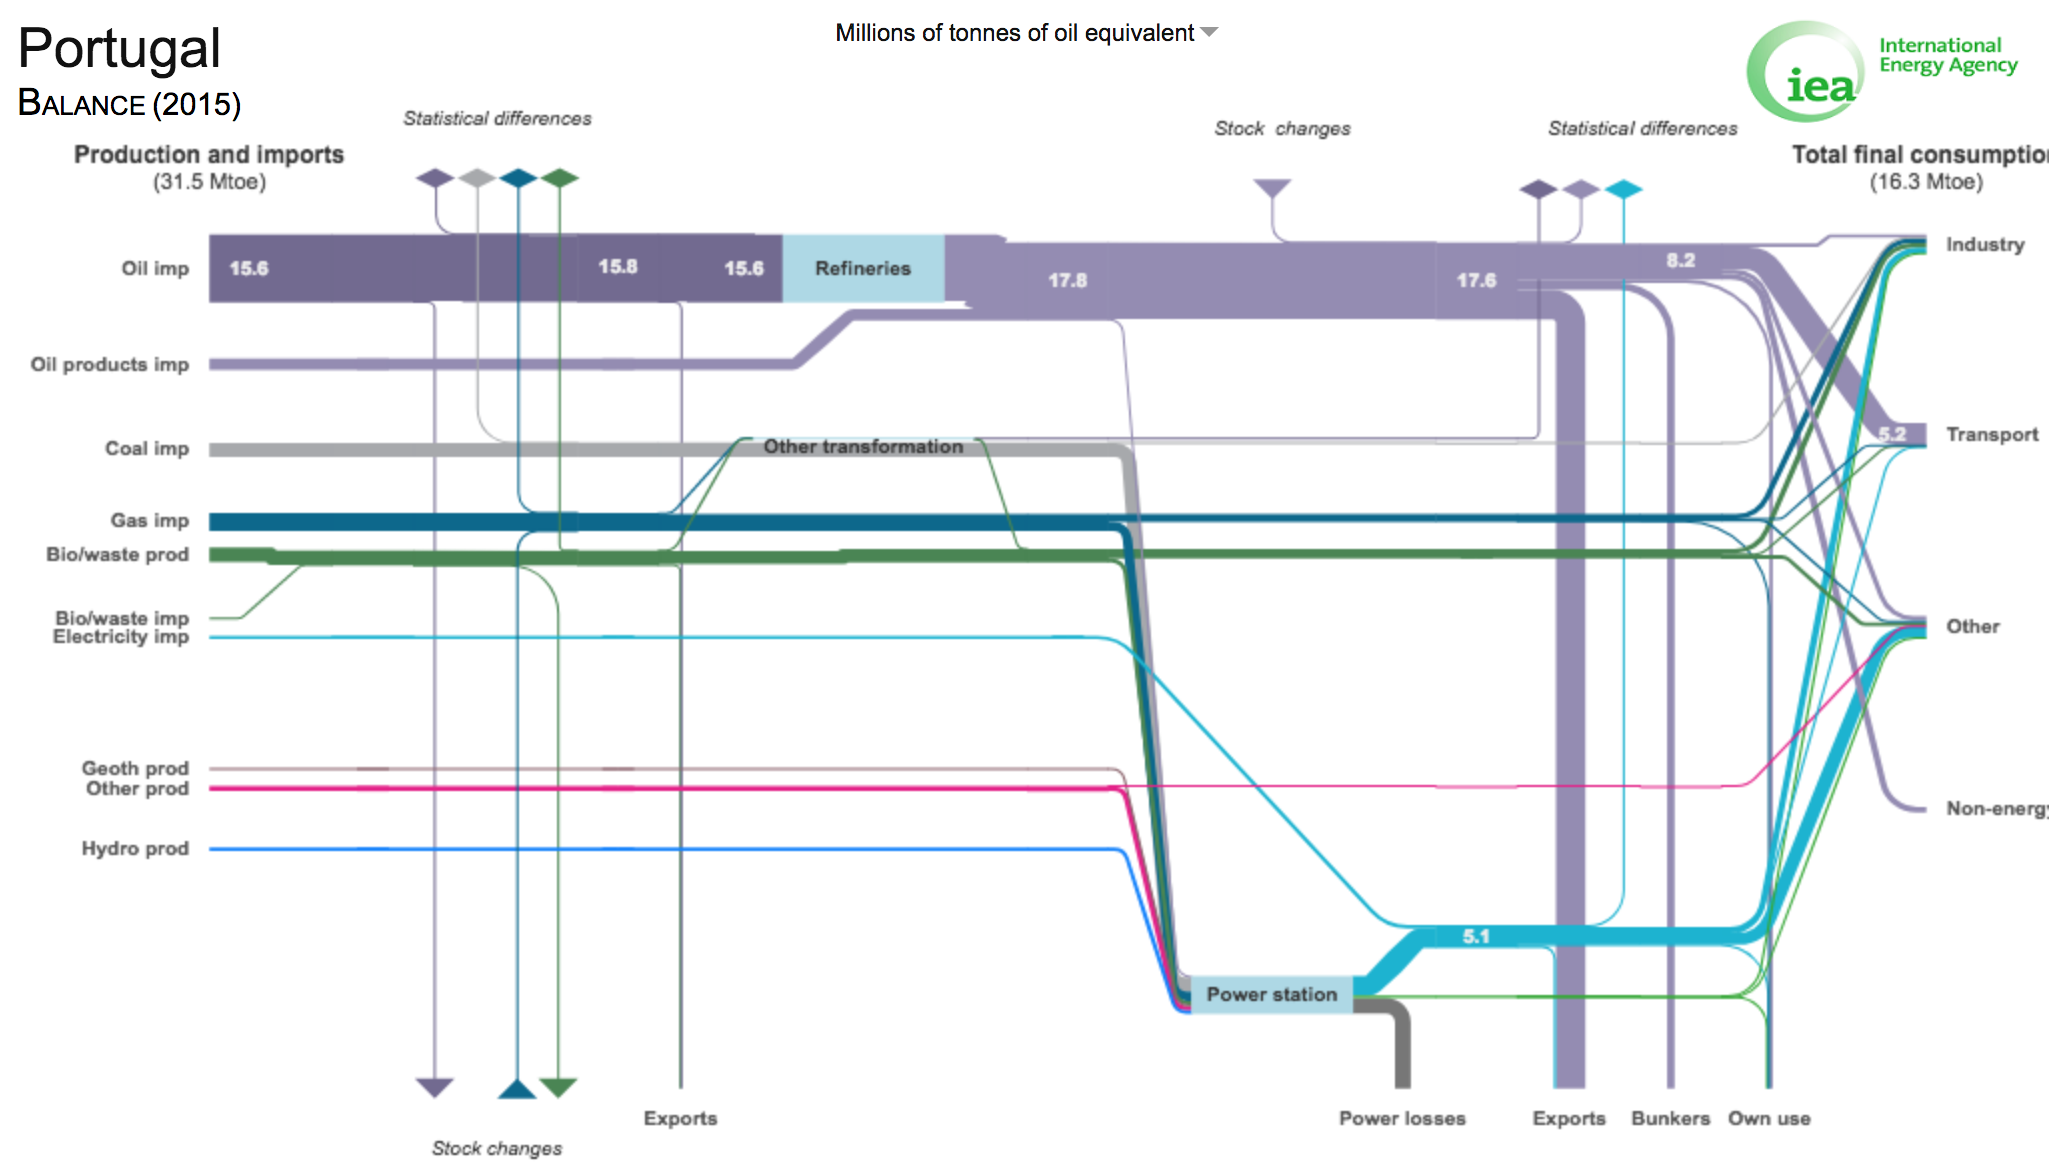
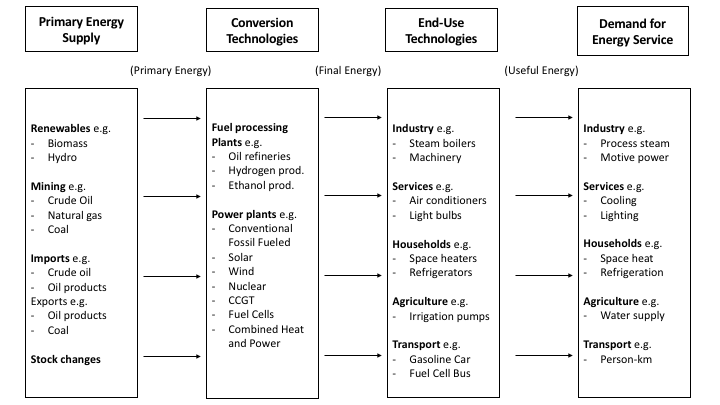
It is a representation of all of the technical activities required to supply various forms of energy to end-use activities.

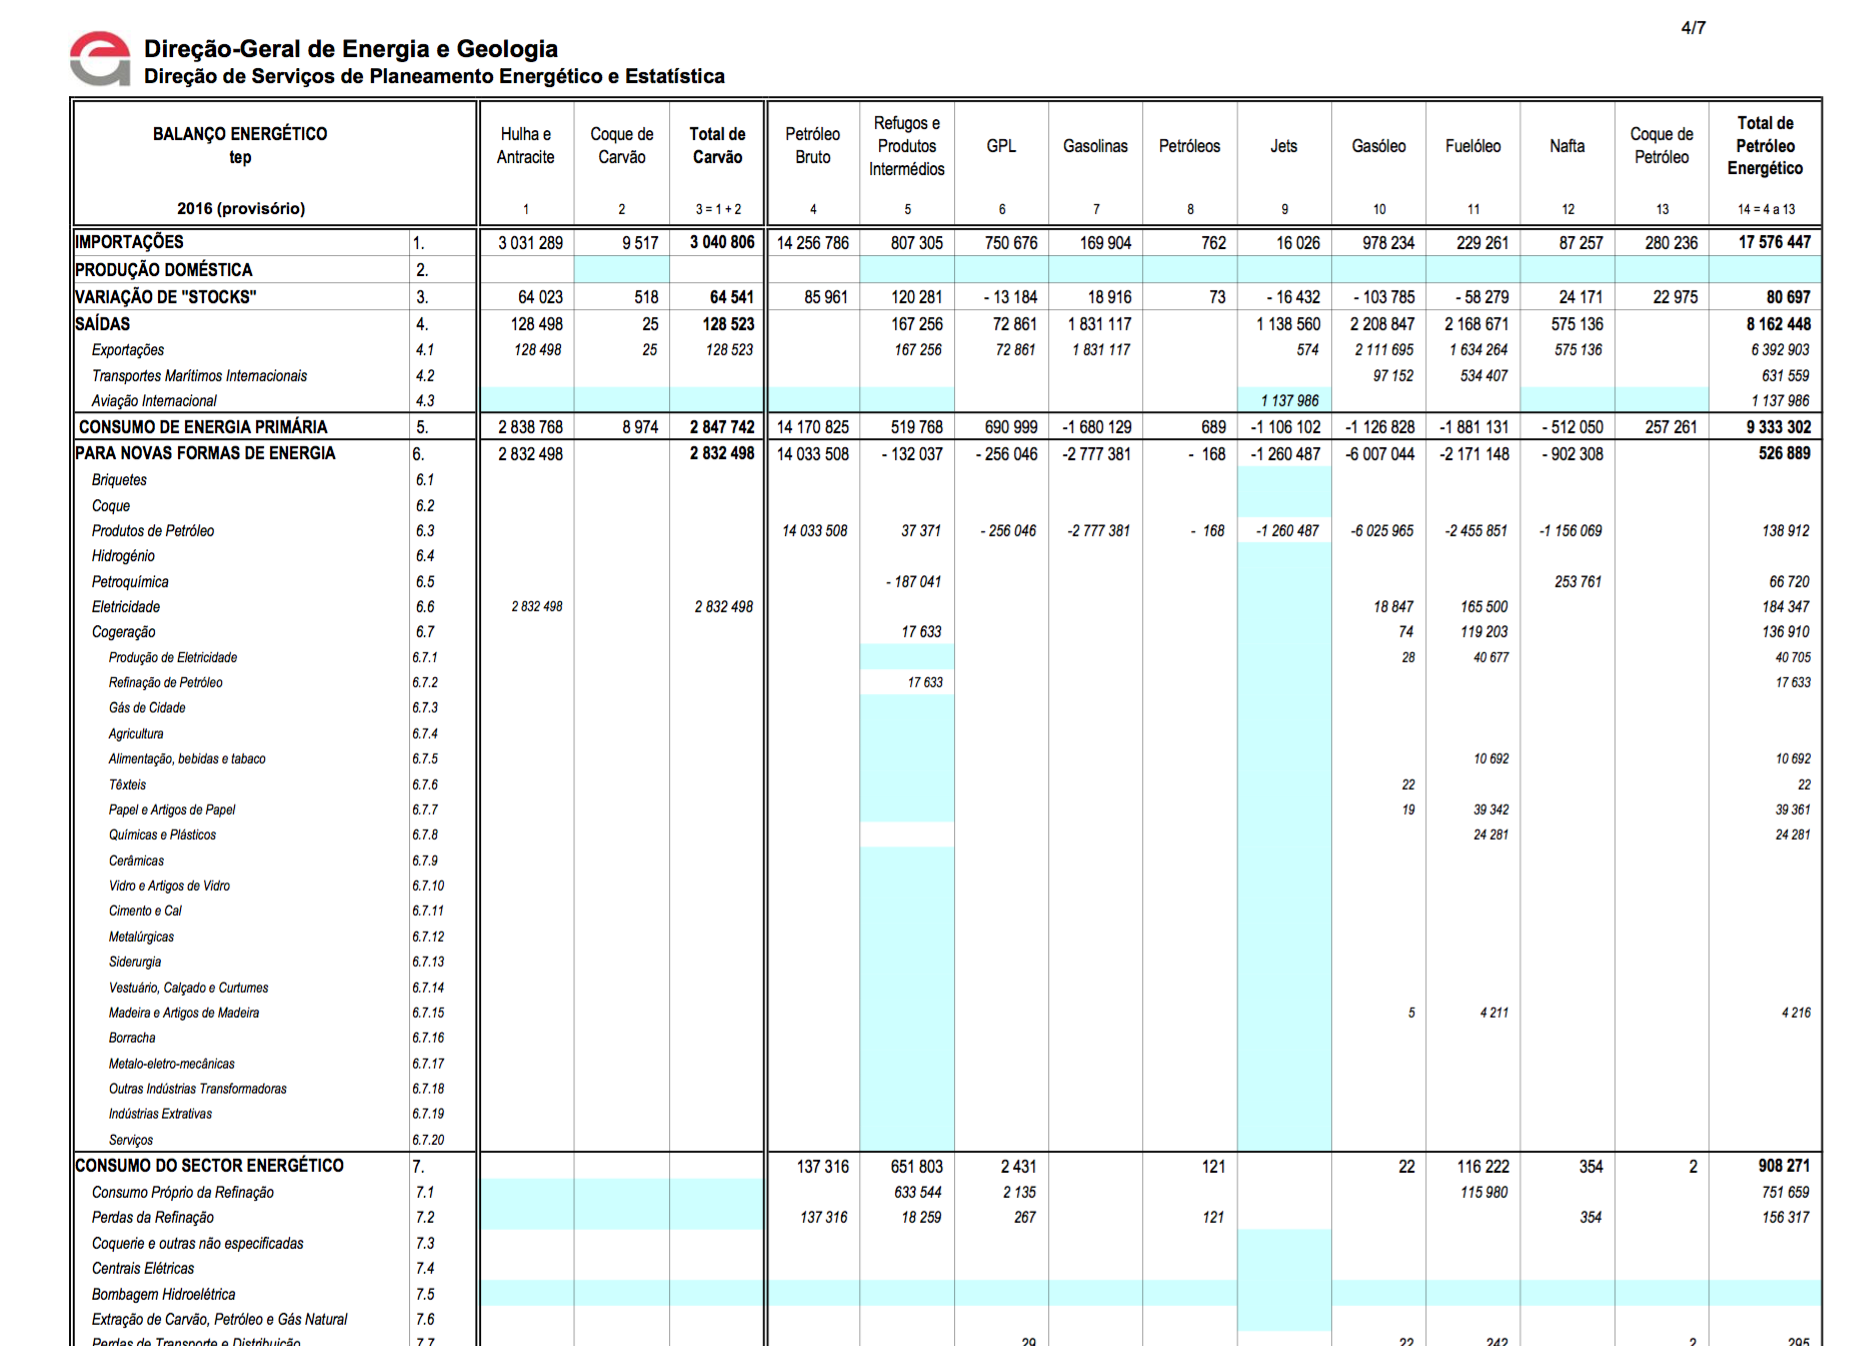
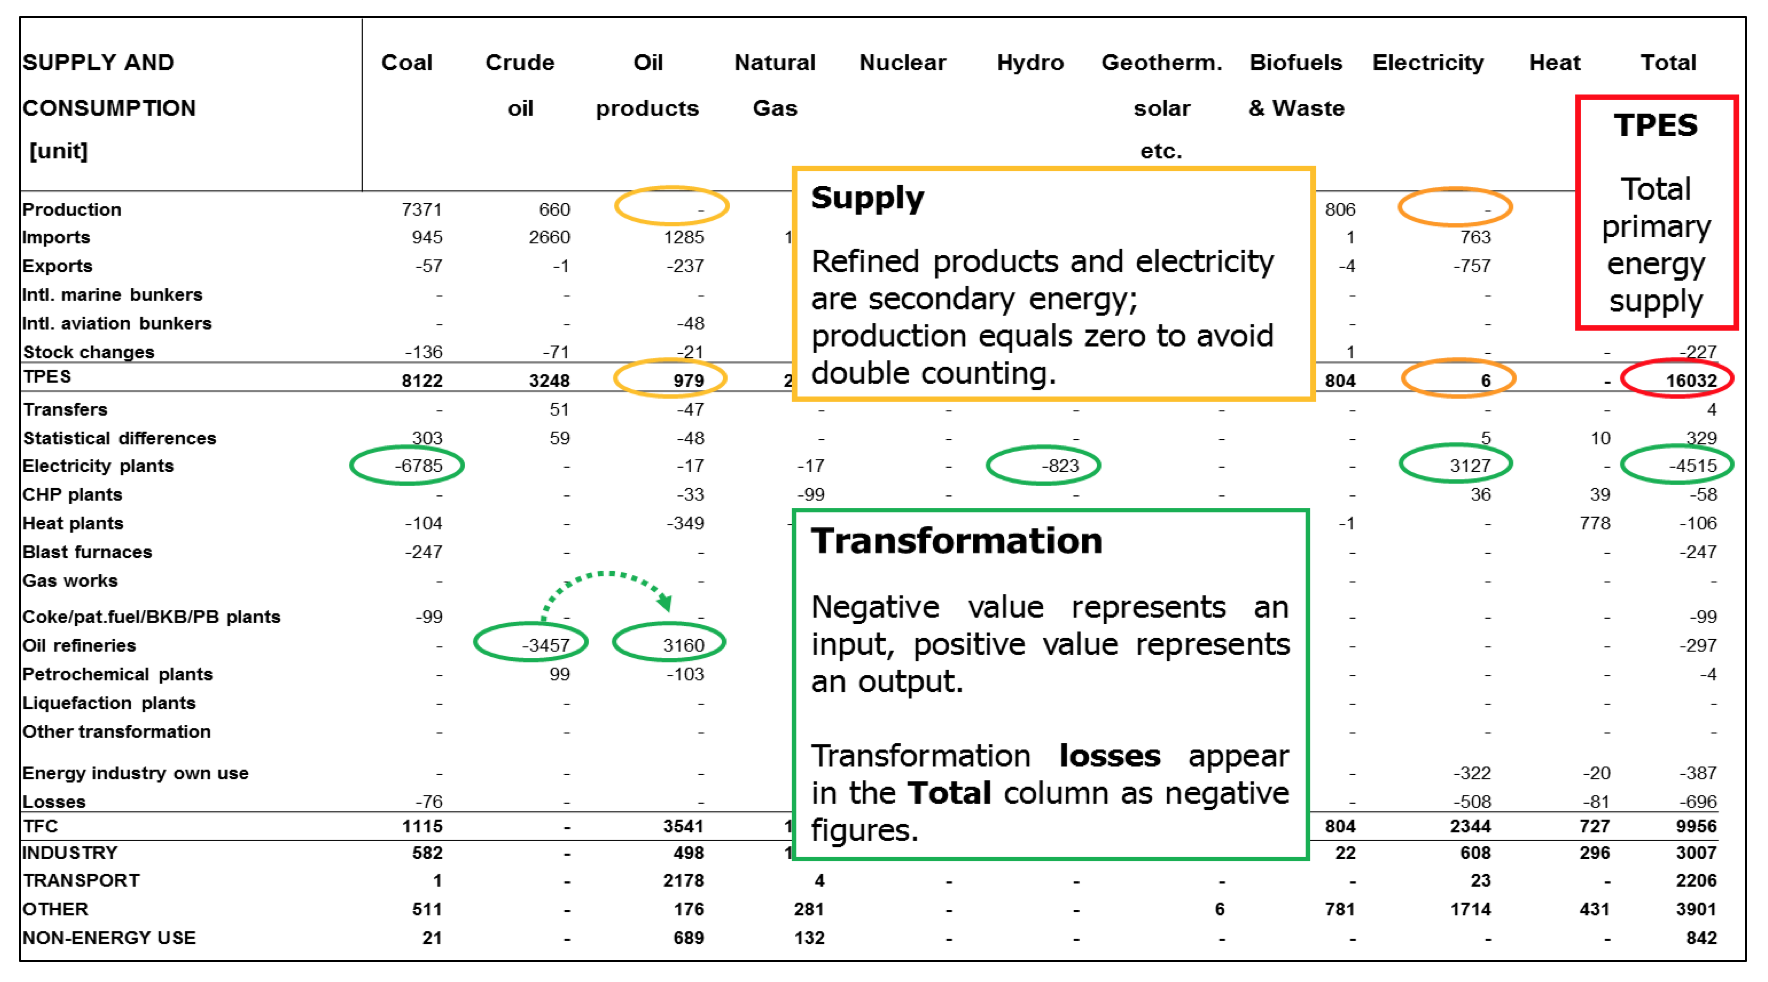
An accounting framework for the compilation of data on all energy products entering, exiting and used within a system (e.g. the national territory of a given country) during a reference period.

It is a diagram that represents activities and the technologies and energy flows from primary energy supply to final energy use and eventually (though not as common) useful energy flows and energy services.

The reference energy system is a framework that helps to describe an energy system by describing the energy flows, the energy conversion technologies and the energy outputs.In practice, the reference energy system is a diagram that represents technologies and processes and the energy flows between these.

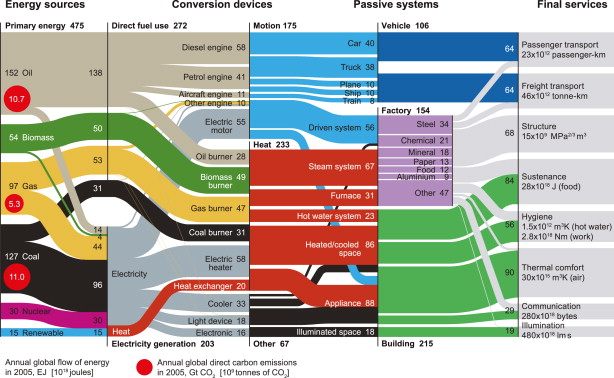
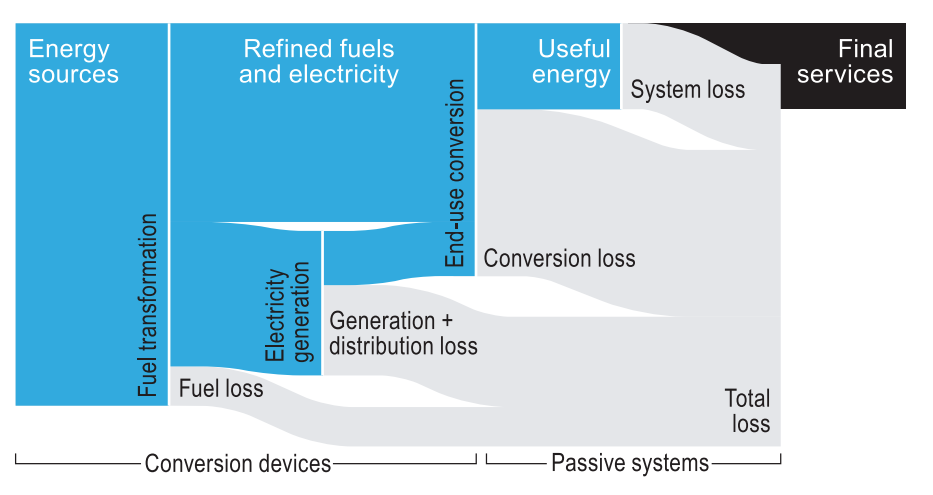
In particular, we introduce now three new concepts: the primary, final and useful energy.The breakdown of primary to final to useful energy is very relevant, because with each conversion step some energy is always lost.

Source: Jonathan M. Cullen, Engineering Fundamentals of Energy Efficiency, PhD Thesis, Cam, Figure 3.1 The flow-path of energy p. 49, available at: link

The design of an efficient energy system consists of avoiding unnecessary losses, we always aim at eliminating unnecessary steps in the flow of energy.

Primary energy is the energy embodied in natural resources which involve extraction, (e.g. oil and coal, but also wind and solar). Primary energy refers to energy sources as found in nature.

Final energy is the result of the transformation of primary energy sources the energy embodied in commodities which involve human transformation (e.g. electricity or gasoline or LPG) and it is usually, energy that is available at the consumer level.

Useful energy is the energy really spent at the end-use technologies. The portion of final energy which is actually available after final conversion to the consumer for the respective use (service). For example, depending on the technology conversion, electricity becomes (e.g. light, mechanical energy or heat).

Energy service Service that is provided by useful energy (E.g. light, mechanical energy or heat)

In the reference energy system, we can observe that on the left side we have the technologies and activities that enable us to collect primary energy (the primary energy supply area), like oil extraction, coal mining, biomass collection, etc. Then, the second area refers to conversion technologies from primary to final energy supply and its transportation, like electricity generation on power plants or oil refining. In some cases, like biomass or natural gas, the primary energy is consumed directly as a commodity (it means final energy) and there is no conversion process.

We have a second level of technologies which are the end-use technologies that allow us to change the final energy into a form of useful energy to perform different activities, like heating, mechanical movement or light, and these activities, which are not energy nor technologies, are the energy services. So, we present here the first definition of energy service that describes an activity that can be performed by means of useful energy.

1.2.1.1 Energy supply and the Energy demand

The energy supply Energy that is extracted from nature. It is basically all the activities that allow extraction, transportation and storage of fuels. Usually energy supply refers to primary energy vectors.

The energy demand Energy that is consumed by a particular system or economic sector. It is the energy required to provide the products and services and usually refers to final energy vectors. The energy demand may be described by technology (in the case of a building energy system) or by economic activity (in the case of a country’s energy system).

Energy Conversion Process that describes the conversion from primary to final (or final to useful).

Waste energy Energy lost in the conversion process.

1.3 Energy Services Definition

Energy Services (ES) is an expression that has been used over the last decade under different circumstances, referring to different meanings, though in general related to energy end-use and energy efficiency contexts.

In particular, two ideas are nowadays associated with this expression:

  • Energy services as a type of description of energy end-uses;

  • Energy services as a certain type of business activity related to the management of energy end-uses;

Though the definitions are different and somehow disjoint, they both refer to understanding energy uses beyond the accounting of the energy used at certain equipment or appliance and suggest that this knowledge enables to design and implement new ways to use energy more efficiently.

This concept is not yet fully consolidated and has been introduced in the literature over the last decades in order to consolidate the concept as it will be used in the rest of the course.

The first formal definition was presented by Groscurth et al. in 1995 and it says that Energy services are the ends for which the energy system provides the means.

In 2005, in the report Energy Services for the New Millennium, by the United Nations Development Programme and the World Bank, Energy Services have been defined as follows: Energy services refer to the services that energy and energy appliances provide or, in a simpler way, Energy services are the benefits that energy carriers produce for human well-being.

In 2007, the International Energy Agency uses the term in the report “Energy for the New Millennium” as the actual services for which energy is used, e.g. heating a given amount of space to a particular temperature for a period of time. Finally, in 2010, Harvey published the book called “Energy Efficiency And The Demand For Energy Services” where he also uses energy end uses as energy services. Despite all previews sources, Energy Services has been in general most used when talking about Energy Service Companies, ESCOs, which as the definition proposed by the Department of Energy of US are the companies that develop projects to save energy.

This term refers explicitly to companies that provide the service related to energy. This is in line with the definition proposed in 1998 by the World Trade Organization, that described energy services in an international report about the liberalization of energy markets as the value added by energy goods which are different from the energy goods itself. So, finally, we present the energy service definition that will be used in the rest of the course which is that an energy service describes the value added by the use of energy. This definition may refer, as presented in the video Energy System, to the activities that result by means of useful energy, but may also refer to the commercial service provided by an ESCO.

The point is that energy service is not measured in energy units, because it does not refer explicitly to energy but to an activity and therefore should be measured in the activity units (e.g. providing hot water, it should refer to the temperature at which the water is provided; transportation, it should refer to km travelled; pumping water it should refer to water height).

1.3.0.1 From useful energy to energy services

Passive systems: where useful energy is delivered into and mostly lost as unwanted heat, in exchange for energy services such as thermal comfort, illumination and transport (Cullen et al., 2011)

1.4 Tools to describe Energy Systems

1.4.1 Energy balance

Energy balance is a tabular representation of the energy system that presents in an aggregated way the amounts of energy used in given activities. (i.e. a reference energy system that is rotated 90º, with numerical values). Energy balances can be used to describe the use of energy in a country or a building. A thorough analysis of the energy balance can provide us with several information about how the energy system is designed and how it operates.

The energy balance is a table wherein the columns we have the energy vectors or products (primary or final or eventually useful) and in the rows, we have the activities on the supply or the demand (or eventually the services). Then in each cell, we place the amount of energy (primary or final) that was used in each activity (supply, conversion or energy end use).

Energy commodities (fuels) are mainly bought for their heat-raising properties. They can also be converted into different products (derived fuels). Therefore it is useful to present the energy supply and energy consumption in energy units (terajoules or tons of oil equivalent). The format adopted is termed the energy balance.

The energy balance allows seeing the relative importance of the different fuels in their contribution to the economy. The energy balance is also the starting point for the construction of various indicators as well as analyses of energy efficiency. Eurostat’s energy balance has a format identical to that of the commodity balance but expressed in an energy unit.

Key structural features of the IEA energy balance

The key energy balance concepts are highlighted with different colour schemes in an exemplary energy balance table below.

Source: EIA Global Headline Energy Data (2017 edition)

For more detailed explanation:


IEA Energy statistics manual


UN International Recommendations on Energy Statistics (IRES)

Other sources

EU: https://ec.europa.eu/eurostat/web/energy/data/energy-balances

IEA: https://www.iea.org/Sankey/#?c=Portugal&s=Balance

1.4.1.1 Portuguese Energy Balance (DGEG)

Balanço Energético Nacional 2016

Direct Link to file

There we can see that in the columns we have primary energy (coal) and final (electricity, heat,energy vectors) and in the lines we have the activities or the technologies.

In the case of a country, the activities may refer to extraction or mining of fossil fuels or the collection of renewable resources, called Production (which in fact is a term that should be avoided when talking about energy, as according to the first law of thermodynamics, energy cannot be produced or destroyed). We also have the imports (in the form of primary energy like coal or final, like electricity of refined fuels).

1.4.2 How energy is used in the residential sector in Portugal

Focusing on Residential use (in the final energy demand area) we can see that electricity and combustible renewables (biomass) are the most important vectors, followed by gas and oil products. In this particular case, we cannot see here in this compact format, but these oil products correspond mostly to Liquefied Petroleum Gas (LPG) products.The use of final energy as heat is very small (as in Portugal we only have a very small district heating network operating at the residential level).

1.4.3 Flux Diagrams

1.4.4 Sankey Diagram

Sankey diagram is a graphical representation of flows in a system in which the width of the arrows is shown proportionally to the flow quantity. We can think about them as a mixture of the reference energy system and the energy balance.

1.4.4.1 Sankey diagram of the Portuguese energy system (IEA)

Represents the flows between primary and final energy.

Source IEA Direct Link

We can see that:

  • oil is still the most used energy resource and is mostly used for transportation;

  • the losses;

  • import and export flows;

  • most oil products are locally refined and from those part is exported.

  • electricity generation as a diverse mix of resources, from coal to gas and renewables.

  • For Portugal, the gas is introduced in the 90’s and how the electricity from renewables is introduced in the 2000’s.

Sankey diagrams should be extended to the energy service level

Cullen and Allwood they have done the Sankey diagram of the world, extending it to the final energy service levels and the corresponding useful energy flows.

Source: Jonathan M. Cullen, Engineering Fundamentals of Energy Efficiency, PhD Thesis, Cam, Figure 3.2 Tracing the global flow of energy from fuel to service p. 58, available at: link


1.4.4.2 Technical components ranked by the scale of energy use

Energy source EJ Conversion device EJ Passive system EJ Final service EJ
Oil 152 Diesel engine 58 Appliances/equipment 88 Thermal comfort 90
Coal 127 Electric heater 58 Heated/cooled space 86 Sustenance 84
Gas 97 Electric motor 55 Furnace 67 Structure 68
Biomass 54 Biomass burner 49 Driven system 56 Freight transport 64
Nuclear 30 Gas burner 47 Car 40 Passenger transport 64
Renewables 15 Petrol engine 41 Truck 38 Hygiene 56
Cooler 33 Steam system 31 Communication 29
Coal burner 31 Hot water system 23 Illumination 19
Oil burner 28 Illuminated space 18
Heat exchanger 20 Plane 10
Light device 18 Ship 10
Electronic 16 Train 8
Aircraft engine 11
Other engine 10
————- —- —————– —- ————— —- ————–
Direct fuel use 272 Heat 233 Buildings 215
Electricity 183 Motion 175 Factory 154
Heat 20 Other 67 Vehicle 106
————- —- —————– —- ————— —- ————–
Total 475 Total 475 Total 475 Total 475

Source: Jonathan M. Cullen, Engineering Fundamentals of Energy Efficiency, PhD Thesis, Cam, Table 3.6 Technical components ranked by the scale of energy use p. 48, available at: link

We can see, for example, that communications require today more energy than illumination and that the consumption of energy for hygiene is as large as the consumption of fuel in passenger transportation.This gives us a new vision of how energy is consumed and can induce the new way of designing energy systems that are more efficient.

1.4.5 Energy around the World

1.4.5.1 World Sankey Diagram

The world Sankey Diagram clearly describes the world energy system. On the demand side, the world energy demand is more or less divided equally into three parts:Transports, Industry and Other uses.

However, there is a significant amount of energy uses which are energy products which are used as raw materials (e.g. oil products like asphalt for road construction or oil for lubricants).

It is also obvious that almost all the transportation sector uses oil products and its derivatives;

Industry has a more diverse energy mix as it uses: coal, gas and electricity and Others use Electricity, Gas and Biomass

The Others sector refers to Residential, Commercial and Public Services Agriculture and Forestry, Fishing and Non-Specified Uses

Taking into account that Residential, Commercial and Public Services are all developed in buildings we can see that a significant part of the Others sector is basically describing the energy demand in the Buildings sector.

Though the statistics do not refer to a specific sector called buildings grew the demand in this sector is often considered as a proxy to the demand in Buildings, And in that case, we can see that it is one of the most important sectors in terms of demand.

A special note related to Agriculture, Forestry and Fishing. The energy consumption in these sectors is usually considered very small, but in general it has to do with the account systems in these economic sectors (i.e. the Agriculture activity per se may involve some consumption of fuel in machines, but the production of fertilizers is a significant part of the Industry demand. This would not happen if energy statistics were based on energy services, where one of the services would be the Production of Food, and which would include the consumption of energy for fertilizers and the machines).

We can also see in the diagram that electricity is generated mostly by coal, followed by gas. We see that all the renewables, including biomass and hydro, still represent only a part of electricity generation.

On the supply side, we see that Oil still represents a large share of primary energy supply consumption,followed by coal, gas and then biomass.

1.4.5.2 Total Primary Energy Supply by source

Into detail to the main energy flows around the world. Let’s observe in detail the aggregated statistics for primary and final energy in the world.

Source: IEA World Energy Balances 2017 Methodology Statistics

1.4.5.3 Primary Energy Consumption (World)

Energy developments

  • Primary energy consumption growth averaged 2.2% in 2017, up from 1.2 % last year and the fastest since 2013. This compares with the 10-year average of 1.7% per year.

  • By fuel, natural gas accounted for the largest increment in energy consumption, followed by renewables and then oil.

  • Energy consumption rose by 3.1% in China. China was the largest growth market for energy for the 17th consecutive year.

Source: BP Statistical Review

1.4.5.3.1 Primary Energy: Consumption

In this review, primary energy comprises commercially-traded fuels, including modern renewables used to generate electricity. USSR includes Georgia and the Baltic States. Excludes Estonia, Latvia and Lithuania prior to 1985 and Slovenia prior to 1990. Note: Growth rates are adjusted for leap years.

The first graph describes the world final energy consumption. Over the last 40 years final energy consumption grew from 4000 megatons of oil equivalent to more than 14000 mtoe.

1.4.5.4 By fuel

1.4.5.5 Oil

In 1973 oil represented almost fifty percent of the final energy consumption while in 2013 it represented only forty percent. Now it is less dominant but still there is a net growth.

In 1973, oil represented almost forty-six percent of the final energy consumption while in 2013 represented only thirty-one percent, which means that today oil is almost all used for transportation but still there is a net growth.

The most important growth was from coal and gas.Coal grew almost two times. Coal is almost today as important as oil but compared to the final energy demand we can see that the most of it is converted into electricity.

Gas grew 3.5 times. It has replaced oil consumption in many applications like heating and generation and industry. Regarding the other vectors nuclear has been stable for the last three decades,Hydro is still the most important renewable energy resource and the others, like wind and solar, were not use except for the last decade. In general, economic development is highly correlated to energy consumption.

1.4.5.6 Natural Gas: Consumption

1.4.5.7 Coal Consumption

1.4.5.8 Nuclear

1.4.5.9 Hydroelectricity

1.4.5.10 Renewables: Consumption - Solar

1.4.5.11 Renewables: Consumption - Wind

1.4.5.12 Renewables: Consumption - Geothermal, Biomass and Other

1.4.5.13 Other Renewables: Consumption

1.4.5.14 Electricity generation by fuel (BP Stats, 2018)

Electricity grew from less than ten percent, 400 megatons of oil equivalent to eighteen percent, which means it grew four times. Electricity has been increasing its importance and it’s today the second-largest where energy vector that is consumed and is ahead of natural gas. In terms of primary energy over last 40 years energy grew from 5,000 megatons to 13,000 megatons of oil equivalent, which means it grew more than the final energy. This indicates that the overall efficiency of conversion has decreased.

Includes sources not specified elsewhere e.g. pumped hydro, non renewable waste and statistical discrepancies. ^ Less than 0.05.
* Commonwealth of Independent States also sometimes called the Russian Commonwealth

1.4.5.15 OECD countries

We can consider that the OECD countries are the ones that have in general attend a developed economy and none of the OECD countries are the developing countries. So it is expected that regions that have high economic growth require significant energy consumption growth while the ones that are already developed require less energy consumption.

If we look to the primary energy supply by region and not by fuel, over the last 40 years, world primary energy grew mostly in developing countries. In fact, OECD countries’ energy consumption grew only from 3,000 to 4,000 megatons of oil equivalent and represents today less than forty percent compared, to the sixty percent in the seventies. Thus, we can see in the figure that in the OECD countries the energy consumption has not grown but rather is decreasing which means that only these economies are having more modest economic growth or most probably they are also having increasing their energy efficiency. We can see that the continuous growth of primary energy consumption in the world over the last 50 years has been mostly driven by non-OECD countries. This is particular to for China, in the late nineties, and many other emerging Asian economies.

Finally, if we look into detail to the case of electricity generation we can see that over the last 40 years, electricity consumption grew from 5,000 terawatt-hours to more than 20,000. Most of electricity is generated in fossil thermal power plants, and from those mostly from coal, and that hydro power plants are the second largest electricity generators, ahead of nuclear.

We can also see that despite the growth of wind and solar power plants in the last two decades the absolute weight in electricity generation is still very small. In 1973 fossil fuels represented more than seventy-five percent of generation but today they still represent over sixty percent. For further details you can look into the data in the International Energy Agency website.

1.4.6 Other Sankey Diagrams

1.4.6.1 EU Sankey diagrams tool (Energy balance flows)

Source: https://ec.europa.eu/eurostat/web/energy/data/energy-balances

Source: data

You can explore different parameters in these diagrams, e.g. the relative weight of each fuel, losses from source to end use.

More information on Sankey Diagrams

1.4.6.1.1 Services

Unlike the one from Cullen et Allwood (on “The efficient use of energy” paper), the breakdown of the final energy consumption is per economic activity (industry, transportation and other sectors).

You can search the node “Services”, on the right, and check the pie chart for this node:

You may also want to know just your country´s energy flows (so you can set on the left menu).

For further information on the EU: “Sankey Diagrams for energy balance”

1.4.6.2 US (Department of Energy, DOE)

You may also want to explore the DOE´s (US) similar tool “Dynamic Manufacturing Energy Sankey”


1.4.6.3 Energy forecast for 2050
Source: Department of Energy & Climate Change


1.4.7 Energy Efficiency Indicators


  • IEA Energy Efficiency Indicators Database (2017 edition)

  • Considering 4 different countries in different geografies: Portugal, Germany, US and Japan.

1.4.7.1 Energy consumption data

1.4.7.1.1 Residential energy consumption

US, Portugal, Japan and Germany

Germany

Japan

Portugal

United States

1.4.7.2 Services Energy consumption

Germany

Japan

Portugal

(no data)

United States

1.4.7.3 Industry energy consumption

  • Manufacturing [ISIC 10-18;20-32] Total final energy (PJ)

  • Paper pulp and printing [ISIC 17-18] Total final energy (PJ)

  • Chemicals & chemical Products [ISIC 20-21] Total final energy (PJ)

  • Non-metallic minerals [ISIC 23] Total final energy (PJ)

  • Basic metals [ISIC 24] Total final energy (PJ)

  • Agriculture forestry fishing [ISIC 01-03] Total final energy (PJ)

  • Mining [ISIC 05-09] Total final energy (PJ)

  • Construction [ISIC 41-43] Total final energy (PJ)

Germany

Portugal

Japan

United States

1.4.7.4 Transport energy consumption

Germany

Japan

Portugal

Unined States

1.4.8 Energy Efficiency Indicators

1.4.8.1 Residential energy indicators

1.4.8.2 Germany Total residential Per capita energy intensity

1.4.8.3 Total residential Per dwelling energy intensity

1.4.8.4 Total residential Per dwelling TC energy intensity

1.4.8.5 Residential space heating Per capita energy intensity

1.4.8.6 Residential space heating Per dwelling energy intensity

1.4.8.7 Residential space heating Per dwelling TC energy intensity

1.4.8.8 Residential lighting Per capita energy intensity

1.4.8.9 Residential lighting Per dwelling energy intensity

1.4.8.10 Residential appliances Per capita energy intensity

1.4.8.11 Residential appliances Per dwelling energy intensity

1.4.9 Services energy indicators

Per VA energy intensity (index 2000 - MJ/USD PPP 2010)

1.4.9.1 Industry energy indicators

1.4.9.2 Manufacturing Per VA energy intensity

1.4.9.3 Paper pulp and printing Per VA energy intensity

1.4.9.4 Chemicals chemical Products Per VA energy intensity

1.4.9.5 Non-metallic minerals Per VA energy intensity

1.4.9.6 Basic metals Per VA energy intensity

1.4.9.7 Agriculture forestry,fishing Per VA energy intensity

1.4.9.8 Mining Per VA energy intensity

1.4.9.9 Construction Per VA energy intensity

1.4.10 Transports energy indicators

1.4.10.1 Cars/light trucks,Passenger-kilometers energy intensity (index 2000)

1.4.10.2 Cars light trucks Passenger kilometers energy intensity

1.4.10.3 Cars, light trucks Vehicle kilometers energy intensity

1.4.10.4 Trucks Tonne kilometers energy intensity

1.4.10.5 Trucks Vehicle kilometers energy intensity

Source: Energy Efficiency Indicators database has energy efficiency, end-use energy and carbon intensity data in 4 sectors for IEA countries. link to data

1.4.11 References

1.4.11.1 Energy Services Definition

Modi, V., S. McDade, D. Lallement, and J. Saghir. 2006. Energy and the Millennium Development Goals. New York: Energy Sector Management Assistance Programme, United Nations Development Programme, UN Millennium Project, and World Bank.

Link:

Energy use in the new millennium : trends in IEA countries. Author. International Energy Agency. Published. Paris : IEA, 2007. Physical Description. 165 p. Link:

Energy and the New Reality 1: Energy Efficiency and the Demand for Energy Services, (2010) by L. D. Danny Harvey

Energy service companies (ESCOs)

Energy Services - S/C/W/52 - World Trade Organization

1.4.11.2 Tools to describe Energy Systems

EIA Sankey Diagrams

1.4.11.3 Energy around the World

Jonathan M. Cullen, Julian M. Allwood, The efficient use of energy: Tracing the global flow of energy from fuel to service, Energy Policy, Volume 38, Issue 1, January 2010, Pages 75-81, ISSN 0301-4215, http://dx.doi.org/10.1016/j.enpol.2009.08.054. (http://www.sciencedirect.com/science/article/pii/S0301421509006429)

Foreseer tool (University of Cambridge)

IEA Atlas of Energy